Abstract: Spectrum analyzers are generally a non-time-domain tool that describes changes in the signal in the frequency domain (for the measurement of signal parameters such as signal distortion, modulation, spectral purity, frequency stability, and intermodulation distortion). It is not widely used in the time domain. However, UltraSpectrum, a PC application tool provided by the RIGOLD SA1000 Series spectrum analyzer, can support this application.
The time domain application and analysis of the spectrum analyzer is based on the data set formed by the spectrum data stored in the time domain (spectral data + time information). Through the analysis of the data set, relevant measurement conclusions can be obtained. The following will combine this tool to solve the problem of analyzing the abnormal signal (implied signal) of the DUT.
Time Domain Application and Analysis of Spectrum Analyzers: Signals that capture the value of an implied signal (eg, signals used in the communications field) are generally periodic signals, and the signal generation process carries time information. RIGOLD SA1000 series analyzers provide the upper computer application tool UltraSpectrum. This tool is used to analyze and apply the spectrum data and the time data (shown in the form of a waterfall chart) generated by the frequency domain data.
Figure 1 (or Figure 2) clearly shows how the spectrum data changes over time. In addition to the "visual" changes seen on the image, a quantifiable value of the "change" trend (curve of the fitted signal versus time, reading on the curve) can be obtained by matching the data on the vertical axis. The following began to analyze abnormal signals (implied signals) with this tool.
In Figure 1 (or Figure 2), the abscissa of the waterfall plot is the frequency, the ordinate is the acquisition time (not shown here), and the color domain shows the spectral intensity. The horizontal red line in the middle is a marker line (used to mark a certain spectrum trace at a particular time). It can be seen that the figure shows the accumulated data of the spectrum data currently acquired from the instrument (DSA1020) for a certain period of time. The red area (non-horizontal marking line) is the main signal area (because the signal bandwidth is very small, it is in the waterfall chart. In the performance of the vertical "red line", its left and right are two effective signals. The flattening of the "field ridges" formed by these three signals shows that the signals in this part are stable. On the left side of the main signal, there are three “signs†of “field ridges†(rectangular box mark positions) that appear on the left side of the main signal. These signals are suspicious signals (from right to left, they are named D1-Distrustful1, D2-Distrustful2, and D3-Distrustful3). Figure 3 shows the time-domain signal collected by an oscilloscope (the same signal as measured by the spectrum analyzer), showing a more stable sine wave. It is difficult to find the problem with this signal by looking at Figure 3.
The marker line is moved to the abnormal occurrence position (this abnormal data is selected). This line is shown in FIG. 1. It can be seen that a signal D1 appears on the left side of the main signal in FIG. 1.
Observing Figure 1, we can see that the signal has a certain regularity (the regularity can be deduced from the recorded time). According to the reading, the regularity of D1 signal is found (set the first data number stored as 0):
According to the above table, it can be roughly estimated that the appearance period of the signal is about 38.8s (25.5+13.3). The device under test has a periodic superposition signal and the signal period is about 38.8s (0.0257Hz).
Observing Figure 2, we can see that D2 and D3 signals are difficult to find in the general two-dimensional spectrum display (in the two-dimensional coordinate system shown in Figure 2, D2 and D3 may be considered as the noise floor). However, in the picture of the waterfall, it is more obvious because of the “stability of ridgesâ€, and it is possible to find some “recessive†features of the signal.
Figure 1 and Figure 2 briefly describe the method of studying the signal characteristics through a preliminary analysis of the pattern (observe a periodic signal D1, and two non-perceptible signals D2, D3). The following can be based on the parameters obtained here, such as the occurrence period of D1, frequency values ​​of D2, D3 as clues to analyze the problem of the device under test.
D1, D2, and D3 are not likely to be discovered in oscilloscope time-domain tools, let alone analyzed. From the previous introduction, we can find that the introduction of frequency domain data based on the concept of time domain storage allows us to get more data information.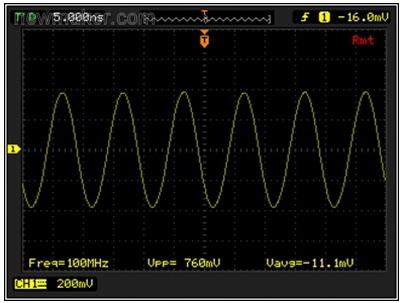
UltraSpectrum completes the time-domain application and analysis of the spectrum analyzer by processing the data generated by the DSA1000 series of spectrum analyzers. It does not require any modification to the original spectrum analyzer, and it only enhances the original data obtained by acquiring only slight changes. The function of the spectrum analyzer, this article only briefly introduces the example of the signal that can be detected by the discovery of suspicious signal analysis. If the data is used in conjunction with other instruments, the application can also be widely expanded (for example, the temperature information can be stored according to the time domain information, ie the time information can be “ Bridges establish the relationship between frequency domain and temperature. The RIGOLD SA1000 series is a low-end spectrum analyzer with low price and abundant native functions. UltraSpectrum is used as a host computer to perform more functional extensions, making this set of spectrum measurement tools more powerful and easy to use. use.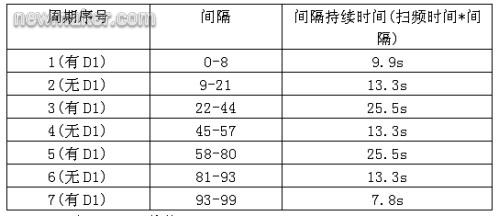
It should be noted that the DSA1000 series spectrum analyzer has a complete open command set system and a rich instrument control interface (LANUSB-TMC). UltraSpectrum was developed based on this. The user's various applications are UltraSpectrum cannot be exhaustive, but based on the native performance of the previously mentioned DSA1000, users can choose a programming tool (LabVIEW, MATLAB, C#, Java, etc.) according to their own situation, and according to Develop your own tools for your own needs.
The time domain application and analysis of the spectrum analyzer is based on the data set formed by the spectrum data stored in the time domain (spectral data + time information). Through the analysis of the data set, relevant measurement conclusions can be obtained. The following will combine this tool to solve the problem of analyzing the abnormal signal (implied signal) of the DUT.
Time Domain Application and Analysis of Spectrum Analyzers: Signals that capture the value of an implied signal (eg, signals used in the communications field) are generally periodic signals, and the signal generation process carries time information. RIGOLD SA1000 series analyzers provide the upper computer application tool UltraSpectrum. This tool is used to analyze and apply the spectrum data and the time data (shown in the form of a waterfall chart) generated by the frequency domain data.
Figure 1: Suspicious signal D1
Figure 1 (or Figure 2) clearly shows how the spectrum data changes over time. In addition to the "visual" changes seen on the image, a quantifiable value of the "change" trend (curve of the fitted signal versus time, reading on the curve) can be obtained by matching the data on the vertical axis. The following began to analyze abnormal signals (implied signals) with this tool.
Figure 2: Suspicious signals D2 and D3
In Figure 1 (or Figure 2), the abscissa of the waterfall plot is the frequency, the ordinate is the acquisition time (not shown here), and the color domain shows the spectral intensity. The horizontal red line in the middle is a marker line (used to mark a certain spectrum trace at a particular time). It can be seen that the figure shows the accumulated data of the spectrum data currently acquired from the instrument (DSA1020) for a certain period of time. The red area (non-horizontal marking line) is the main signal area (because the signal bandwidth is very small, it is in the waterfall chart. In the performance of the vertical "red line", its left and right are two effective signals. The flattening of the "field ridges" formed by these three signals shows that the signals in this part are stable. On the left side of the main signal, there are three “signs†of “field ridges†(rectangular box mark positions) that appear on the left side of the main signal. These signals are suspicious signals (from right to left, they are named D1-Distrustful1, D2-Distrustful2, and D3-Distrustful3). Figure 3 shows the time-domain signal collected by an oscilloscope (the same signal as measured by the spectrum analyzer), showing a more stable sine wave. It is difficult to find the problem with this signal by looking at Figure 3.
The marker line is moved to the abnormal occurrence position (this abnormal data is selected). This line is shown in FIG. 1. It can be seen that a signal D1 appears on the left side of the main signal in FIG. 1.
Observing Figure 1, we can see that the signal has a certain regularity (the regularity can be deduced from the recorded time). According to the reading, the regularity of D1 signal is found (set the first data number stored as 0):
According to the above table, it can be roughly estimated that the appearance period of the signal is about 38.8s (25.5+13.3). The device under test has a periodic superposition signal and the signal period is about 38.8s (0.0257Hz).
Observing Figure 2, we can see that D2 and D3 signals are difficult to find in the general two-dimensional spectrum display (in the two-dimensional coordinate system shown in Figure 2, D2 and D3 may be considered as the noise floor). However, in the picture of the waterfall, it is more obvious because of the “stability of ridgesâ€, and it is possible to find some “recessive†features of the signal.
Figure 1 and Figure 2 briefly describe the method of studying the signal characteristics through a preliminary analysis of the pattern (observe a periodic signal D1, and two non-perceptible signals D2, D3). The following can be based on the parameters obtained here, such as the occurrence period of D1, frequency values ​​of D2, D3 as clues to analyze the problem of the device under test.
D1, D2, and D3 are not likely to be discovered in oscilloscope time-domain tools, let alone analyzed. From the previous introduction, we can find that the introduction of frequency domain data based on the concept of time domain storage allows us to get more data information.
Figure 3: The signal is under the oscilloscope (RIGOLDS1204B screenshot).
UltraSpectrum completes the time-domain application and analysis of the spectrum analyzer by processing the data generated by the DSA1000 series of spectrum analyzers. It does not require any modification to the original spectrum analyzer, and it only enhances the original data obtained by acquiring only slight changes. The function of the spectrum analyzer, this article only briefly introduces the example of the signal that can be detected by the discovery of suspicious signal analysis. If the data is used in conjunction with other instruments, the application can also be widely expanded (for example, the temperature information can be stored according to the time domain information, ie the time information can be “ Bridges establish the relationship between frequency domain and temperature. The RIGOLD SA1000 series is a low-end spectrum analyzer with low price and abundant native functions. UltraSpectrum is used as a host computer to perform more functional extensions, making this set of spectrum measurement tools more powerful and easy to use. use.
Table 1: Statistical statistics of D1 signals
It should be noted that the DSA1000 series spectrum analyzer has a complete open command set system and a rich instrument control interface (LANUSB-TMC). UltraSpectrum was developed based on this. The user's various applications are UltraSpectrum cannot be exhaustive, but based on the native performance of the previously mentioned DSA1000, users can choose a programming tool (LabVIEW, MATLAB, C#, Java, etc.) according to their own situation, and according to Develop your own tools for your own needs.